By Michael Taylor (Senior Analyst, Renewable Energy Cost Status and Outlook, International Renewable Energy Agency)
The clean energy transition will depend largely on successful innovation in the energy sector and will be crucial if countries are to meet their Paris Agreement and increasingly their own domestic goals for net zero by mid-century. Despite this, efforts to systematically track progress in innovation, rather than the inputs to innovation (e.g. R&D investments) remain scant. This leaves a significant gap in understanding how inputs to innovation have translated into outputs at a macro level. Filling this gap may allow important insights for policy makers and assist them in plotting a path that ensures the best chance of having commercialized key technologies when they are needed.
The International Renewable Energy Agency (IRENA), with funding from the European Commission, has embarked on a project to expand and enhance its databases on the costs and performance of renewable energy technologies and those that facilitate the energy transition (e.g. battery storage), and its databases on patents and standards to provide metrics that can be considered proxies for innovation outputs. The project has also looked at how this range of indicators can be considered more holistically, to provide additional qualitative and quantitative insights into ways in which innovative energy technologies are making progress fully or in part due to RD&D activities.
The project started in April 2020 and will conclude in September 2021. IRENA has completed its methodological phase and with the project scope and boundaries defined, embarked on the data collection and analytical process of collecting data for utility-scale solar photovoltaics (PV), concentrating solar power (CSP), onshore and offshore wind, behind-the-meter battery storage and hydrogen electrolysers.
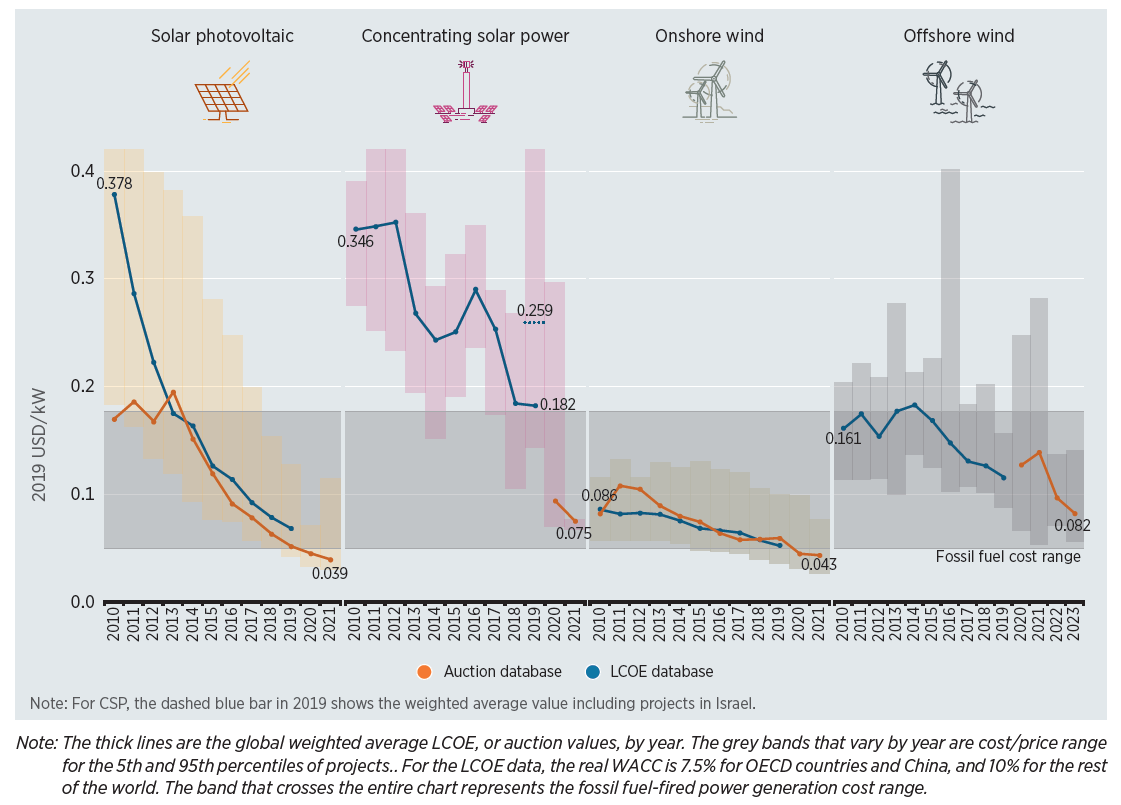
Solar and wind technologies have displayed impressive improvements in performance and cost declines over the last ten years. The global weighted-average levelized cost of electricity (LCOE) of utility-scale solar photovoltaics (PV) fell 82% between 2010 and 2019, while that of CSP fell 47%, onshore wind by 39% and offshore wind at 29% (Figure 1), the IRENA Renewable Cost Database shows.[1] Auction and Power Purchase Agreements (PPA) data suggest costs will continue to fall in the next few years.
Figure 1: Global weighted average LCOE and Auction/PPA prices for CSP, onshore and offshore wind, and solar PV, 2010 to 2023
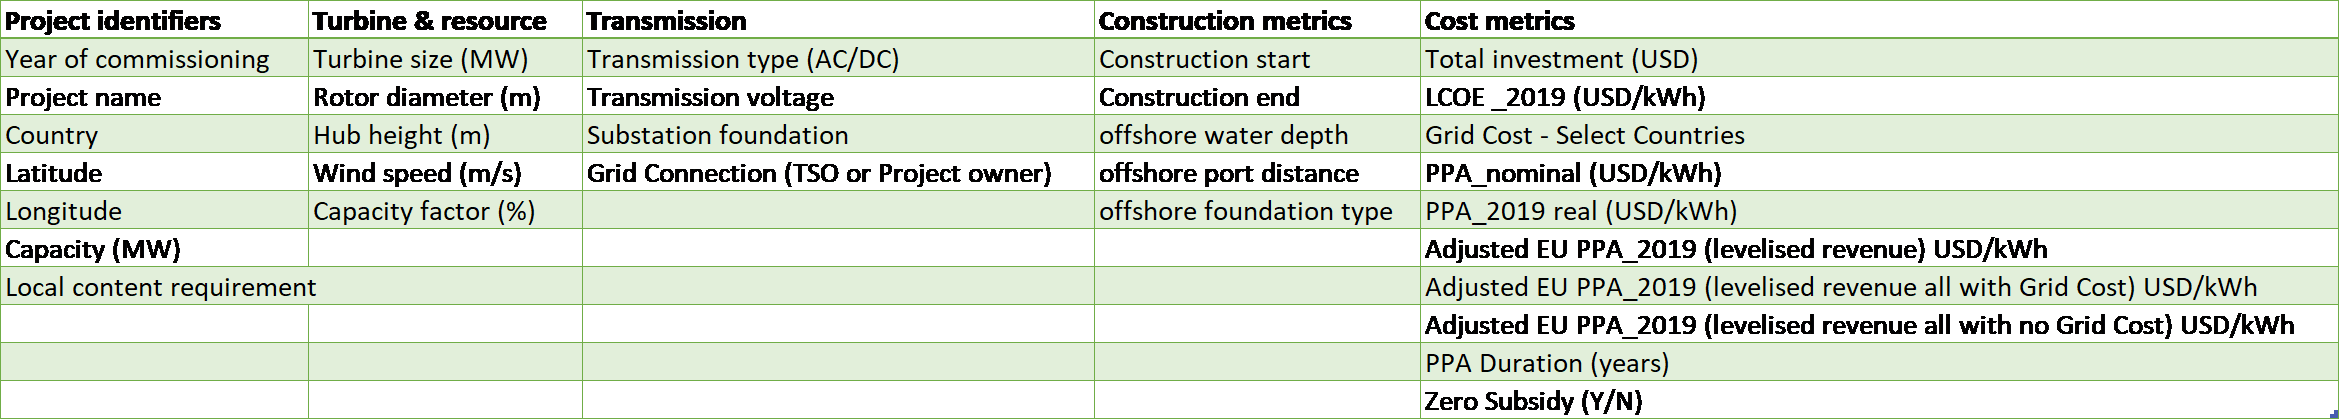
IRENA is expanding the geographic scope of the IRENA Renewable Cost Database for solar and wind technologies to include the majority of the countries that are members of the European Union and Mission Innovation, to make the cost and performance data as meaningful as possible for all stakeholders. At the same time, IRENA is also deepening the cost and performance metric data collection in a way that will allow greater insights about which metrics are being primarily driven by innovations (public or private) and those that are more driven by market or supply chain factors (e.g. learning by doing within companies and more competitive supply chains with economies of scale). For instance, IRENA is collecting data on the average wind speed of onshore wind projects for projects within its database, to more clearly illuminate the role of technology improvements on average capacity factors. Table 1 shows the range of metrics collected by IRENA for virtually every completed offshore wind project in the OECD.
Table 1: Offshore wind cost and performance metrics
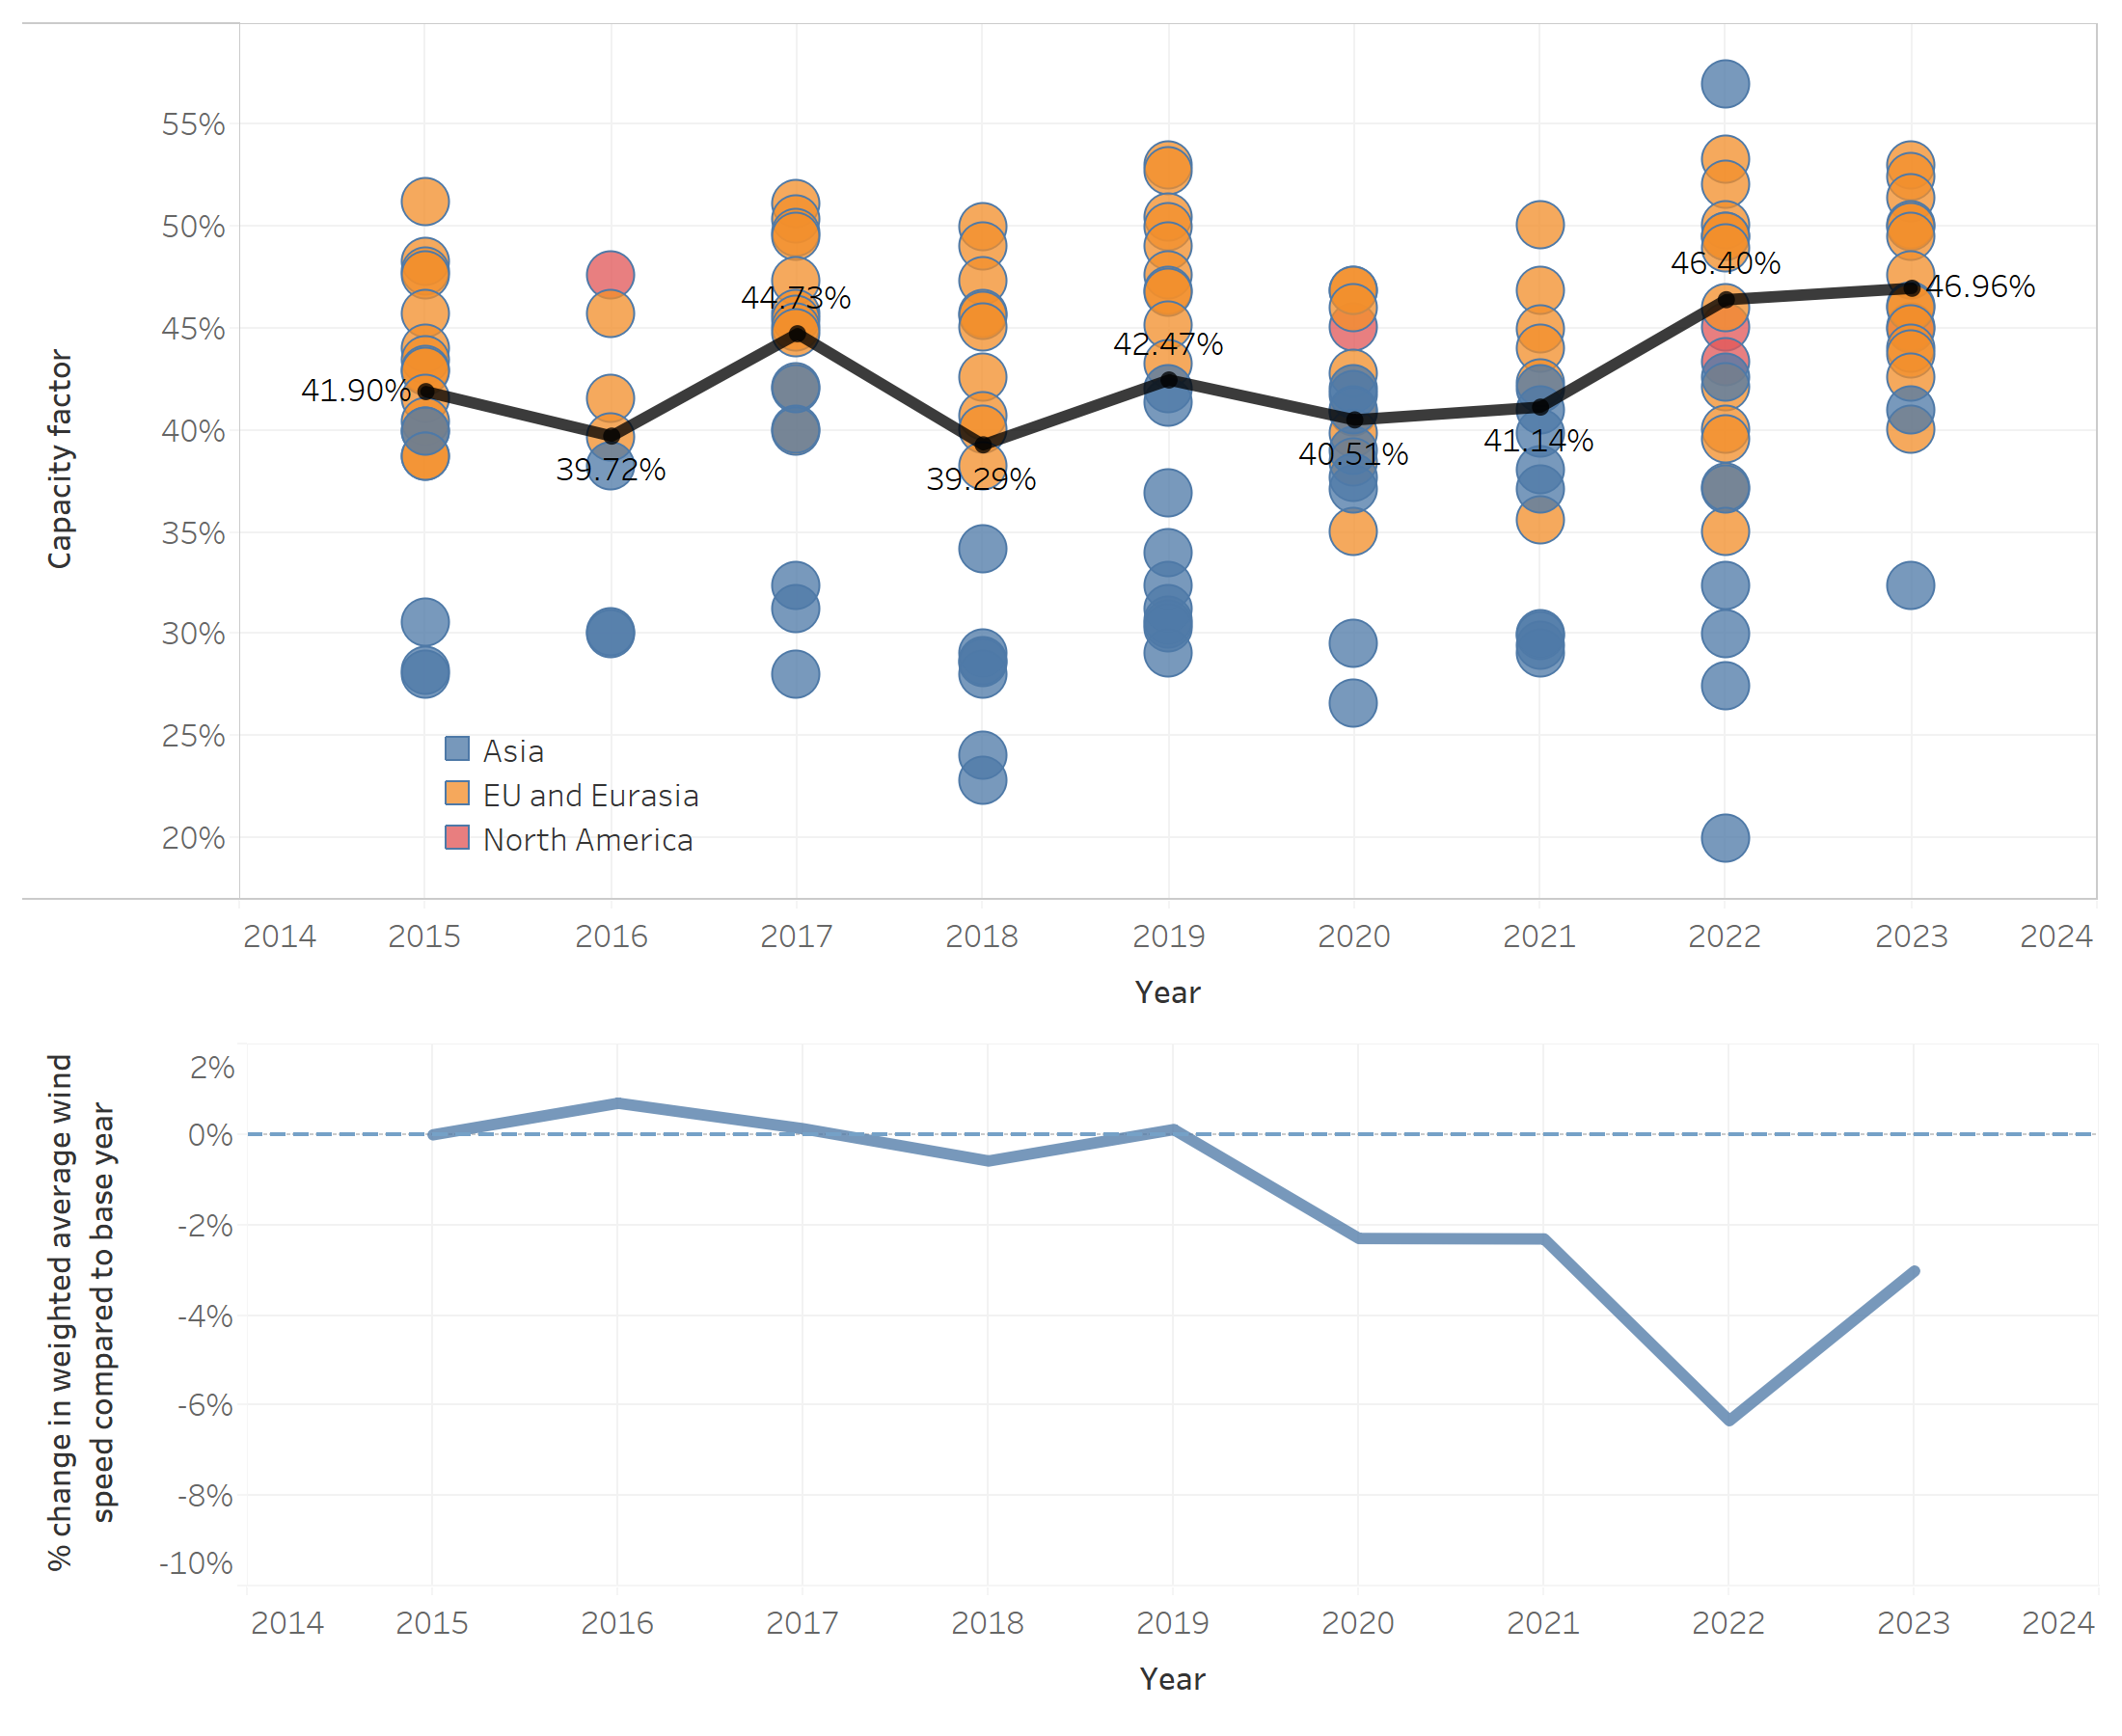
IRENA has piloted the methodology on offshore wind, a technology that has matured and – as witnessed in recent auction and tender results – seen a step change in competitiveness in the last few years. As a brief example of the data, Figure 2 shows how offshore wind project capacity factors have and will increase for projects commissioned between 2015 and 2023 as the technology has evolved, even as the weighted average resource quality of new projects declines relative to 2015.
Figure 2: Capacity factors and wind resource quality of commissioner and planned offshore wind projects, 2015-2023
The data collection and analysis continue for cost and performance, patent and standards metrics. Full results from the analysis will be available in Q3 2021, while IRENA hopes in subsequent work to use the data collected to decompose the change in the cost of electricity based on underlying drivers and changes in performance in detail to understand more closely where innovation has had its greatest impact. Future work could also use the IRENA data to better understand the transmission process for innovation between inputs and outputs.
[1] The IRENA Renewable Cost Database contains cost and performance data on over 18 000 renewable power generation projects that have been either commissioned, under construction or in the pipeline.